Genome Complexity Browser: Visualization and quantification of genome variability Genome Complexity Browser: Visualization and quantification of genome variability
Alexander Manolov, Dmitry Konanov, Dmitry Fedorov, Ivan Osmolovsky, Rinat Vereshchagin, Elena Ilina, Morgan Langille
Abstract
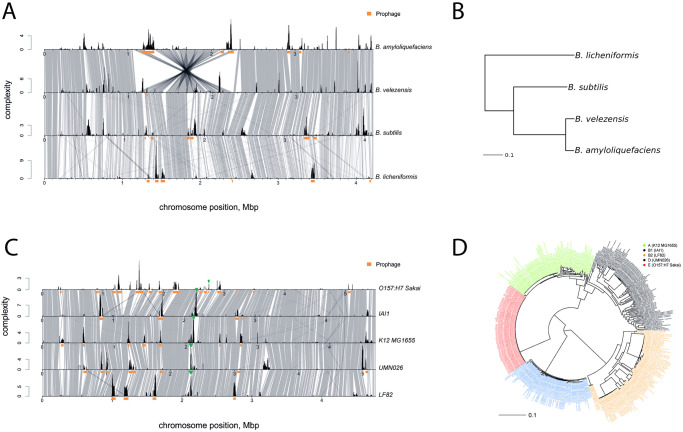
'Rinat Vereshchagin' 'Elena Ilina' 'Morgan Langille'] Comparative genomics studies may be used to acquire new knowledge regarding genome architecture, which defines the rules for combining sets of genes in the genome of living organisms. Hundreds of thousands of prokaryotic genomes have been sequenced and assembled. However, computational tools capable of simultaneously comparing large numbers of genomes are lacking. We developed the Genome Complexity Browser, a tool that allows the visualization of gene contexts, in a graph-based format, and the quantification of variability for different segments of a genome. The graph-based visualization allows the inspection of changes in gene contents and neighborhoods across hundreds of genomes, simultaneously, which may facilitate the identification of conserved and variable segments of operons or the estimation of the overall variability associated with a particular genome locus. We introduced a measure called complexity, to quantify genome variability. Intraspecies and interspecies comparisons revealed that regions with high complexity values tended to be located in areas that are conserved across different strains and species.
§ The Valyu brief
Reading the full paper and taking notes. This takes a few seconds…
§ Ask this paper
Ask a question about this paper
Valyu reads the full text and answers from what the paper actually says.
Searching the other archives…