PyComplexHeatmap: A Python package to visualize multimodal genomics data PYCOMPLEXHEATMAP DING et al.
Wubin Ding, David Goldberg, Wanding Zhou
Abstract
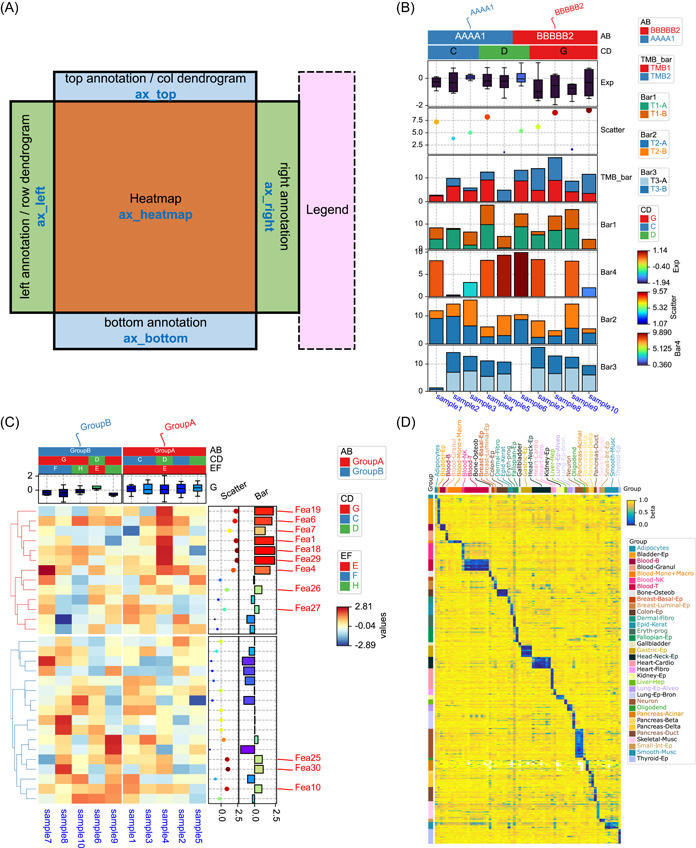
PyComplexHeatmap was designed to visualize matrix data and associated metadata through sophisticated, richly annotated heatmap layouts. We have integrated the R grammar-of-graphics semantics with the Python-native matplotlib/Pandas-based data science ecosystem, allowing users to utilize built-in matplotlib colormaps and project Pandas DataFrame directly as horizontal or vertical color bars. PyComplexHeatmap supports high-level data abstraction and can display up to five data dimensions within a single heatmap visualization.
§ The Valyu brief
Reading the full paper and taking notes. This takes a few seconds…
§ Ask this paper
Ask a question about this paper
Valyu reads the full text and answers from what the paper actually says.
Searching the other archives…